MINERVA
Tech Specs.
See the standstill before it happens. Reports and energy evidence from real measurements. Maintenance instruction and history right at the machine. MINERVA measures at the machine and works with you, on your hardware, in the plant. Industrial AI and edge AI of our own making, from sensor to answer.
Technical details
Boards, interfaces & specs
- Node board (compute)
- STM32N6: TinyML on the board itself, low power
- Hub board (compute)
- Raspberry Pi CM5, passively cooled, or NVIDIA Jetson Orin Nano with GPU for larger AI models
- Probe board (sensor)
- STM32H5: vibration up to 6 kHz, acceleration and angular rate, magnetic field, temperature, humidity, air pressure, gas
- Energy board
- Current, voltage and power metering in real time, as evidence for CSRD
- IO-Link module
- Connects IO-Link sensors to the node via CAN FD
- SPAM module
- Three M12 ports, each with its own CAN FD bus and switched power
- Networking
- CAN FD between probe and node, WiFi between node and hub; hub uplink: Gigabit Ethernet, optional PoE+ (IEEE 802.3at)
- Data access
- Raw data via API, MQTT, or database, your choice
- Enclosure & service
- Bolted aluminum enclosures; USB-C for service and power delivery
- Scaling
- 1 hub, any number of nodes, up to three probe chains per node
- Manufacturing
- All boards developed in-house, no white-label, no reseller
Probe. Node. Hub.
Three devices, one system. Take a look inside each one.
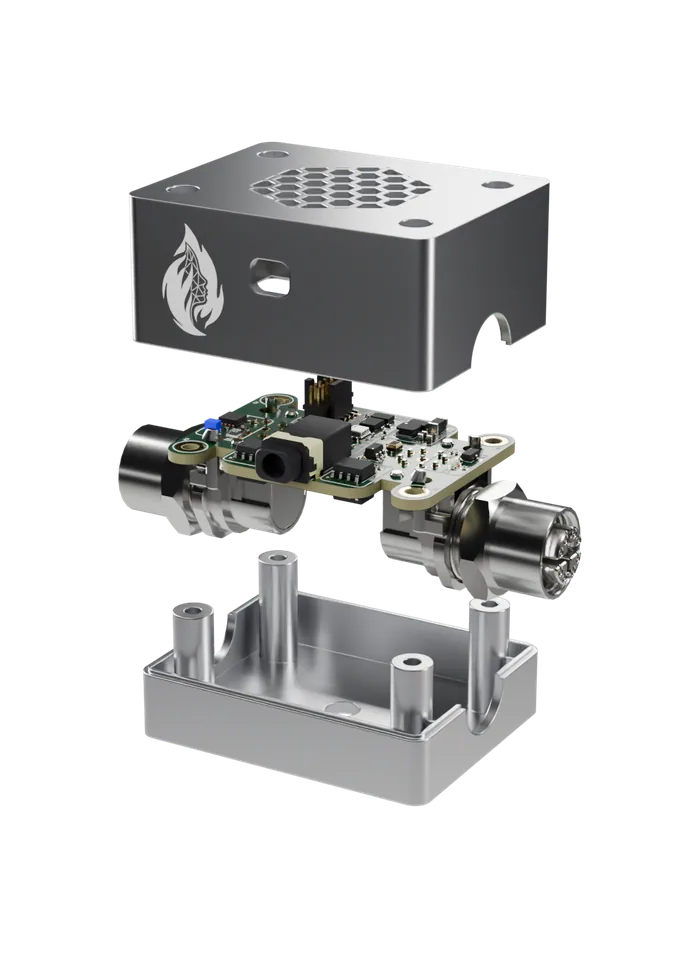
The Probe · At the machine
Measures where it happens.
At the bearing, the spindle, the drive: the Probe sits right at the machine and reads the sensors.
- Bolted aluminum enclosure
- STM32H5 variant. Flexible sensor setup
- M12 · CAN FD. From the Node or the previous Probe
- M12 · CAN FD. On to the next Probe (daisy chain)
To move the measuring point closer to the bearing, undo the M12 and plug it back in. The chain grows with you. Plug a third Probe for the new spindle into the chain and it's detected automatically. The project keeps running, with no rebuild.
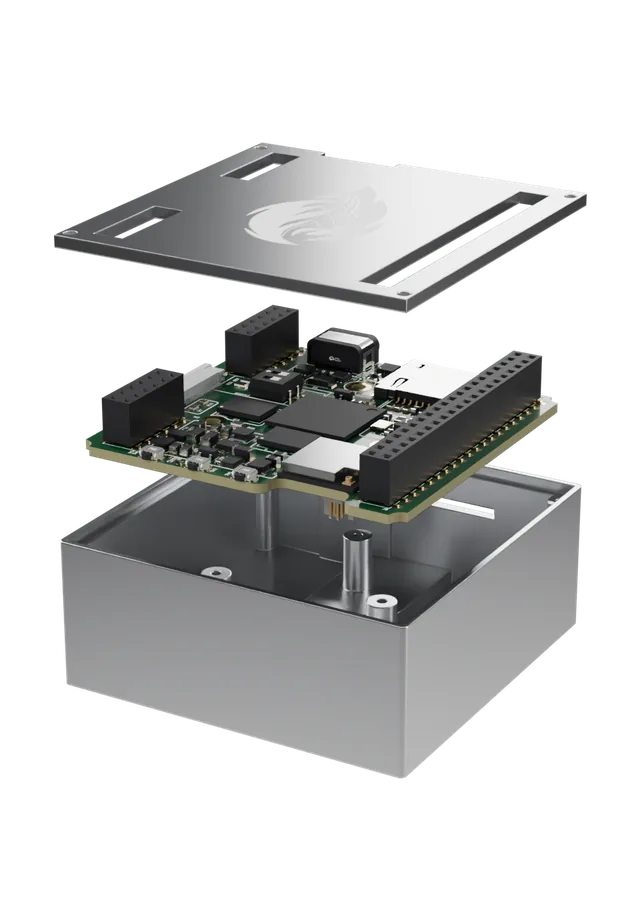
The Node · Near the machine
Computes where it's measured.
The Node bundles up to three Probe chains, processes the values locally, and sends the results to the Hub wirelessly.
- Expansion headers. CAN FD, SPI and I²C: swappable modules, e.g. LoRaWAN
- ESP32-C6. WiFi and Bluetooth: reaches the Hub
- STM32N6. TinyML right on the board
- Bolted aluminum enclosure
For a new machine, put a Node next to it and plug in the Probes. No cable back to a central point, no new switch port. And the AI runs right on the board.
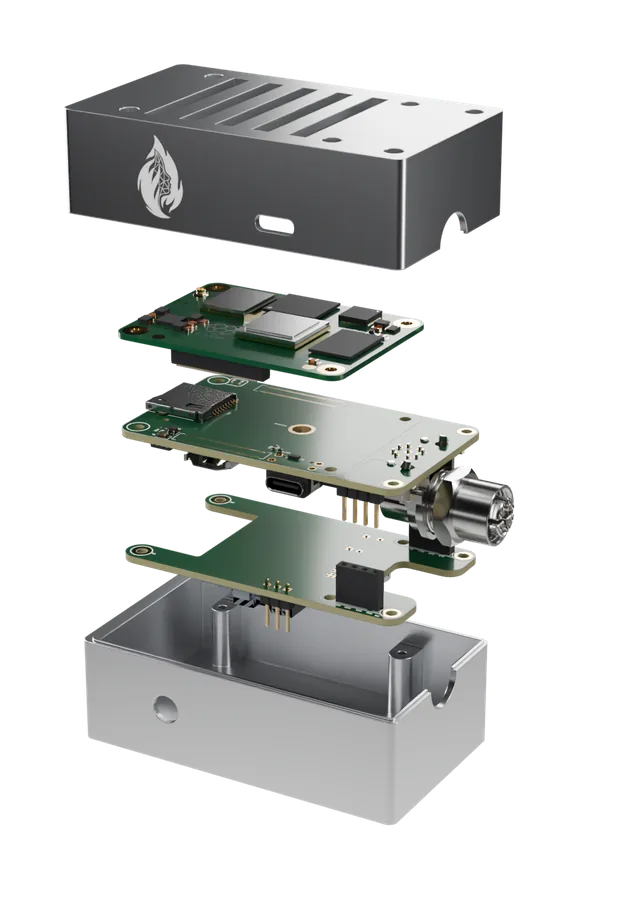
The Hub · On-premise in the plant
Orchestrates the whole plant.
The Hub collects the results from all Nodes and runs the AI models that are too large for the Node. This is where the measurement meets the knowledge in your documents, on-premise, inside the plant.
- WiFi. Receives every Node in the plant
- Vents in the lid. Passively cooled, no fan
- Compute module. Raspberry Pi CM5, AI on the CPU
- USB-C. Service & power delivery
- M12 · Gigabit Ethernet. With optional PoE+: network and power over one cable
Today a Raspberry Pi CM5 does the computing. If your models need more, there is the Hub with an NVIDIA Jetson Orin Nano and GPU. And the Hub talks to LOKI: ask your production in plain sentences.
Topology & scale
Hierarchical. Scalable. Robust.
One Hub orchestrates any number of Nodes, each Node up to three Probe chains. Probes chain together on the CAN FD bus, and the Nodes reach the Hub wirelessly.
HUB: one orchestrator
Scales to the whole plant. New Nodes are detected automatically.
NODES: one per machine
Every machine gets its own Node. That's all it takes.
PROBES: several per Node
The chain gets longer, not the project. Plug in, keep measuring.
Example: 1 Hub · 3 Nodes · 9 Probes. CAN FD (wired) between Probe and Node, WiFi wireless between Node and Hub.
And that is far from everything.
Probe
- Vibration, temperature, magnetic field
- Acceleration and rotation rate
- Humidity, air pressure, gas
- Current, voltage, power with the energy board
- At the bearing, spindle and drive
- Probes daisy-chained on CAN FD
- Plug in a Probe, detected automatically
- Connects either way round
- Move a measuring point via M12
- Raw signal stays on the Probe
- Timestamped right at the Probe
- Bolted aluminum enclosure
Node
- Three CAN lines per Node
- Assigns CAN addresses itself
- TinyML right on the board
- Sends condensed values, not the stream
- Reaches the Hub over WiFi
- No cable back to a central point
- No new switch port
- Interface modules detected automatically
- Existing IO-Link sensors stay
- Reconnects on its own
- Signed admission to the Hub
- No remote-access door
Hub
- Collects results from every Node
- Runs the larger AI models
- One Hub for the whole plant
- Runs without internet
- Dedicated WiFi for the Nodes
- Nodes have no route into your network
- Approve or block each Node
- Raw data via API, MQTT, database
- No paywall on raw data
- Forwarding to your MQTT broker
- Updates with automatic rollback
- CM5 hub passively cooled, no fan
Web interface
- Add Nodes by scanning a QR code with a phone
- No manual IP configuration
- Drag Nodes onto the plant photo
- Plant photo straight from the camera
- Several views, freely named
- Threshold per sensor
- Sample rate per sensor
- Alarms right in the web UI
- Every Node and Probe with status
- Live values and trend
- Also on tablet and phone
- The plant crew makes the changes
With LOKI
- Questions in plain sentences
- Reading and maintenance instruction in one answer
- Answer with citation
- Measured and documented, cited apart
- Says when the data falls short
- Trend chart in the answer
- Abnormal readings flagged
- Threshold breaches with duration
- Relationship between two signals
- Stops from the event log
- Load profiles on request
- Also runs without LOKI
As of the 2026 design partner program. More features are being built together with our design partners.
Scene · Line 3 is down
Why is line 3 down?
One question from the early shift. The answer names its four sources. Early shift, 07:14.
What was measured
RMS per bearing · 24-hour average · 13 to 20 July. Bearing 1 in color, bearings 2 to 4 in gray.
- Bearing 1 maximum
- 0.725 g single reading
- Readings flagged
- 44, from 17 July on
- Bearings 2 to 4
- 0.11 g at most
What the plant has on file
Maintenance instruction WA-L3-014, revision 4, effective 21 Jan 2026, filed in the document store, never in a time series.
| Level | Reading | Action |
|---|---|---|
| Normal | up to 0.12 g | observe the trend |
| Warning | above 0.12 g | trend review, shift log |
| Alarm | above 0.25 g | notify maintenance, order spare bearing |
| Shutdown | single reading above 0.40 g | immediate stop |
How the diagnosis comes about
| Trait | Measured | Documented damage pattern |
|---|---|---|
| Progression | RMS rising steadily over days | rising RMS |
| Bearings | only bearing 1 abnormal, 2 to 4 in band | exactly one bearing |
| Peaks | increasing isolated peaks | increasing isolated peaks |
MINERVA
The vibration monitor shut the line down at 07:10. The progression at bearing 1 is an outer race defect: remove, inspect, document the finding. Spare bearing Rexnord ZA-2115, replace as a set only.
What I cannot tell you
Confirming this needs a frequency analysis of the raw signal. In normal operation only condensed readings are archived; the raw signal for this bearing sits on the probe and is available through the API.
- 1Maintenance instruction WA-L3-014 · p. 1 to 2
- 2Test rig bearing documentation · p. 2
- 3Time series vibration_rms · bearings 1 to 4
- 4Event log line 3 · 20 July, 07:10
The problem
The reading is already there. The answer is missing.
Four reasons.
Data and knowledge live apart
The reading sits in the historian, the limit in a maintenance instruction on a file share, the similar case from March in the head of whoever worked the late shift. Getting an answer means collecting all three, and knowing they exist in the first place.
Data leakage & compliance
Machine data is the crown jewels of any production. With cloud IoT it ends up on someone else's servers, often in third countries. CLOUD Act, NIS2, and the EU AI Act turn this into a compliance trap.
Latency & availability
Predictive maintenance needs response times under 100 ms. A cloud round-trip makes that impossible. Any network outage stops the analysis. And the value with it.
Lock-in instead of flexibility
In closed IoT bundles, sensors often come only from the vendor, raw data sits behind a paywall and every change becomes a project. Cloud inference is billed per data point. The bill grows with every machine.
MINERVA solves all four differently, because it is open and modular. And it shares what it hears.
Platform
IGNAITE is the platform.
LOKI for your knowledge. MINERVA for your machines. HEIMDALL for the safe path to the cloud. SAGA for your meetings. Each product runs on its own, can be started individually and extended with the others at any time. Together they become your company’s memory: LOKI, MINERVA and HEIMDALL share one machine, one login, one role model, one audit log and one works agreement. Every application inherits what is already in place. SAGA brings LOKI’s technology into the meeting room.
What MINERVA measures, LOKI explains in full sentences, with maintenance instructions and history.
Compliance
Answers for data protection and audit.
GDPR without third-country transfer, a processing agreement only for remote maintenance, ISO 27001 as a declared goal, prepared for the EU AI Act, access rights that reach down into the vector index. See how it works technically.