MINERVA · Edge AI for production

Your machines have been telling a story all along.
Who is listening?

AI where your value is created, right at the machine. Local, in real time. No data point leaves the plant.

Your machines are talking. MINERVA listens.

The limit sits in a maintenance instruction, the last bearing service in the maintenance system, the similar case from March in someone's head. MINERVA measures right at the machine and brings the measurement together with all of it, on site, on your own hardware.

SCENE · LINE 3 IS DOWN

One question from the early shift. The answer names its four sources.

Early shift, 07:14

Why is line 3 down?

MINERVA

What was measured

0.100.200.30 13.15.17.20.
Bearing 1 Bearings 2 to 4

RMS per bearing · 24-hour average · 13 to 20 July

Bearing 1 maximum
0.725 g single reading
Readings flagged
44, from 17 July on
Bearings 2 to 4
0.11 g at most

What the plant has on file

Maintenance instruction WA-L3-014, revision 4, effective 21 Jan 2026, filed in the document store, never in a time series.

LevelReadingAction
Normalup to 0.12 gobserve the trend
Warningabove 0.12 gtrend review, shift log
Alarmabove 0.25 gnotify maintenance, order spare bearing
Shutdownsingle reading above 0.40 gimmediate stop

How the diagnosis comes about

TraitMeasuredDocumented damage pattern
Progression RMS rising steadily over days rising RMS
Bearings only bearing 1 abnormal, 2 to 4 in band exactly one bearing
Peaks increasing isolated peaks increasing isolated peaks

The vibration monitor shut the line down at 07:10. The progression at bearing 1 is an outer race defect: remove, inspect, document the finding. Spare bearing Rexnord ZA-2115, replace as a set only.

What I cannot tell you

Confirming this needs a frequency analysis of the raw signal. In normal operation only condensed readings are archived; the raw signal for this bearing sits on the probe and is available through the API.

4 sources used ▾
  • [1]Maintenance instruction WA-L3-014 · p. 1–2
  • [2]Test rig bearing documentation · p. 2
  • [3]Time series vibration_rms · bearings 1 to 4
  • [4]Event log line 3 · 20 July, 07:10
The problem

The reading has always been there. The answer hasn't.

Four reasons.

Data and knowledge live apart

The reading sits in the historian, the limit in a maintenance instruction on a file share, the similar case from March in the head of whoever worked the late shift. Getting an answer means collecting all three, and knowing they exist in the first place.

Data leakage & compliance

Machine data is the crown jewels of any production. With cloud IoT it ends up on someone else's servers, often in third countries. CLOUD Act, NIS2, and the EU AI Act turn this into a compliance trap.

Latency & availability

Predictive maintenance needs response times under 100 ms. A cloud round-trip makes that impossible. Any network outage stops the analysis. And the value with it.

Lock-in instead of flexibility

Closed IoT bundles: sensors often only from the vendor, raw data behind a paywall, every change becomes a project. And cloud inference is billed per data point. The bill grows with every machine.

MINERVA answers all four with a different principle: open, modular, and it shares what it hears.

The system

Three tiers. No black box.

Every board an in-house design. We open them up for you, down to the chip.

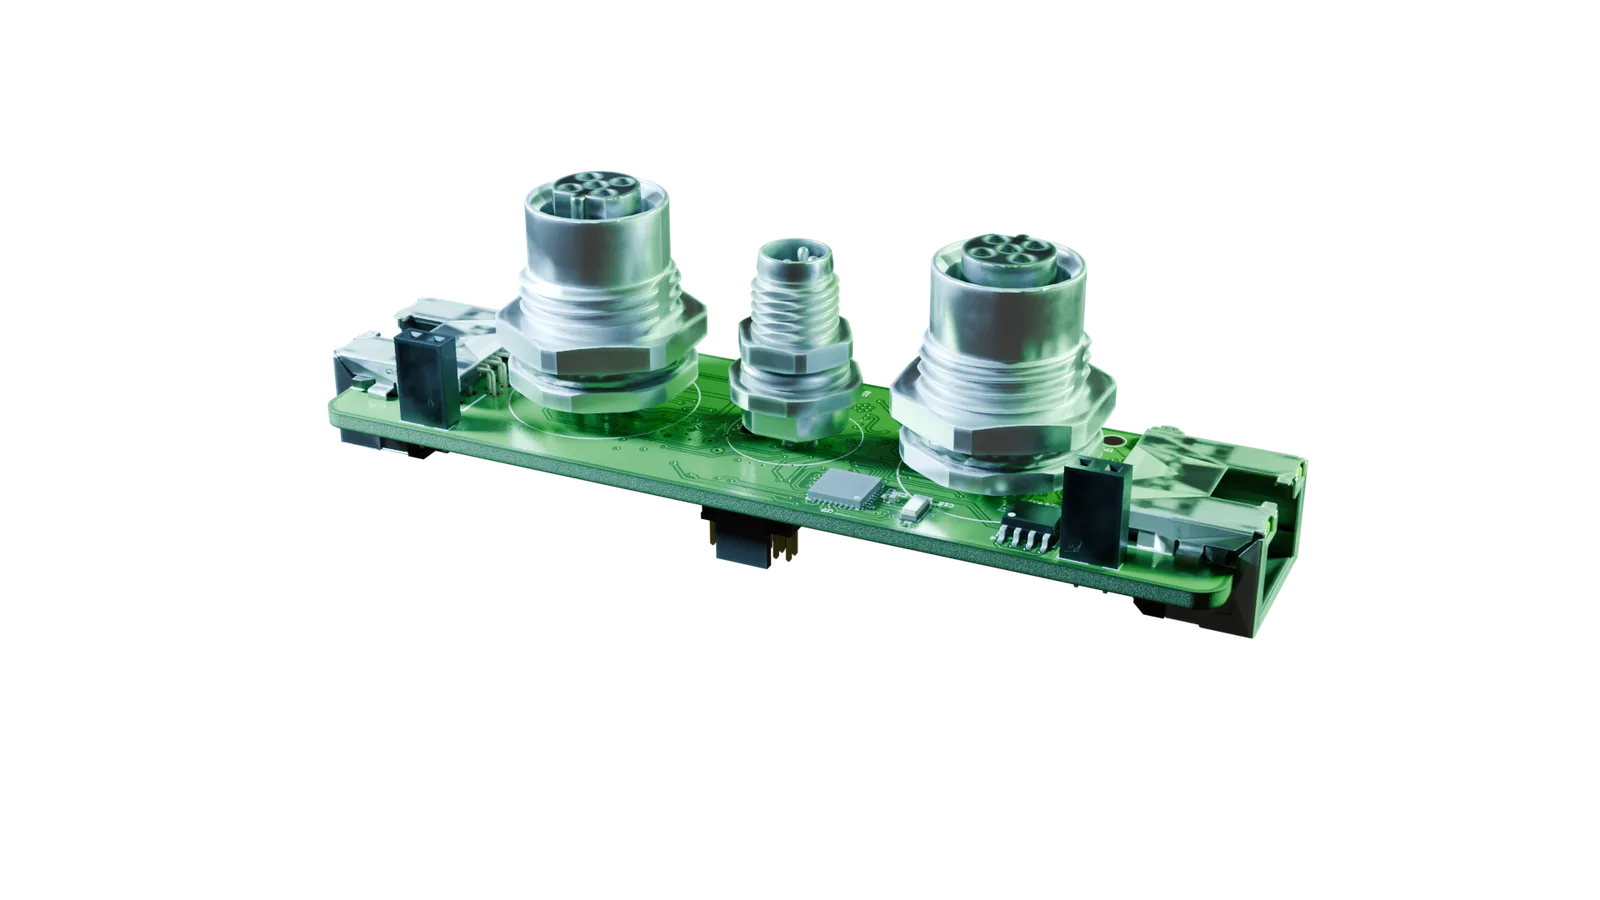
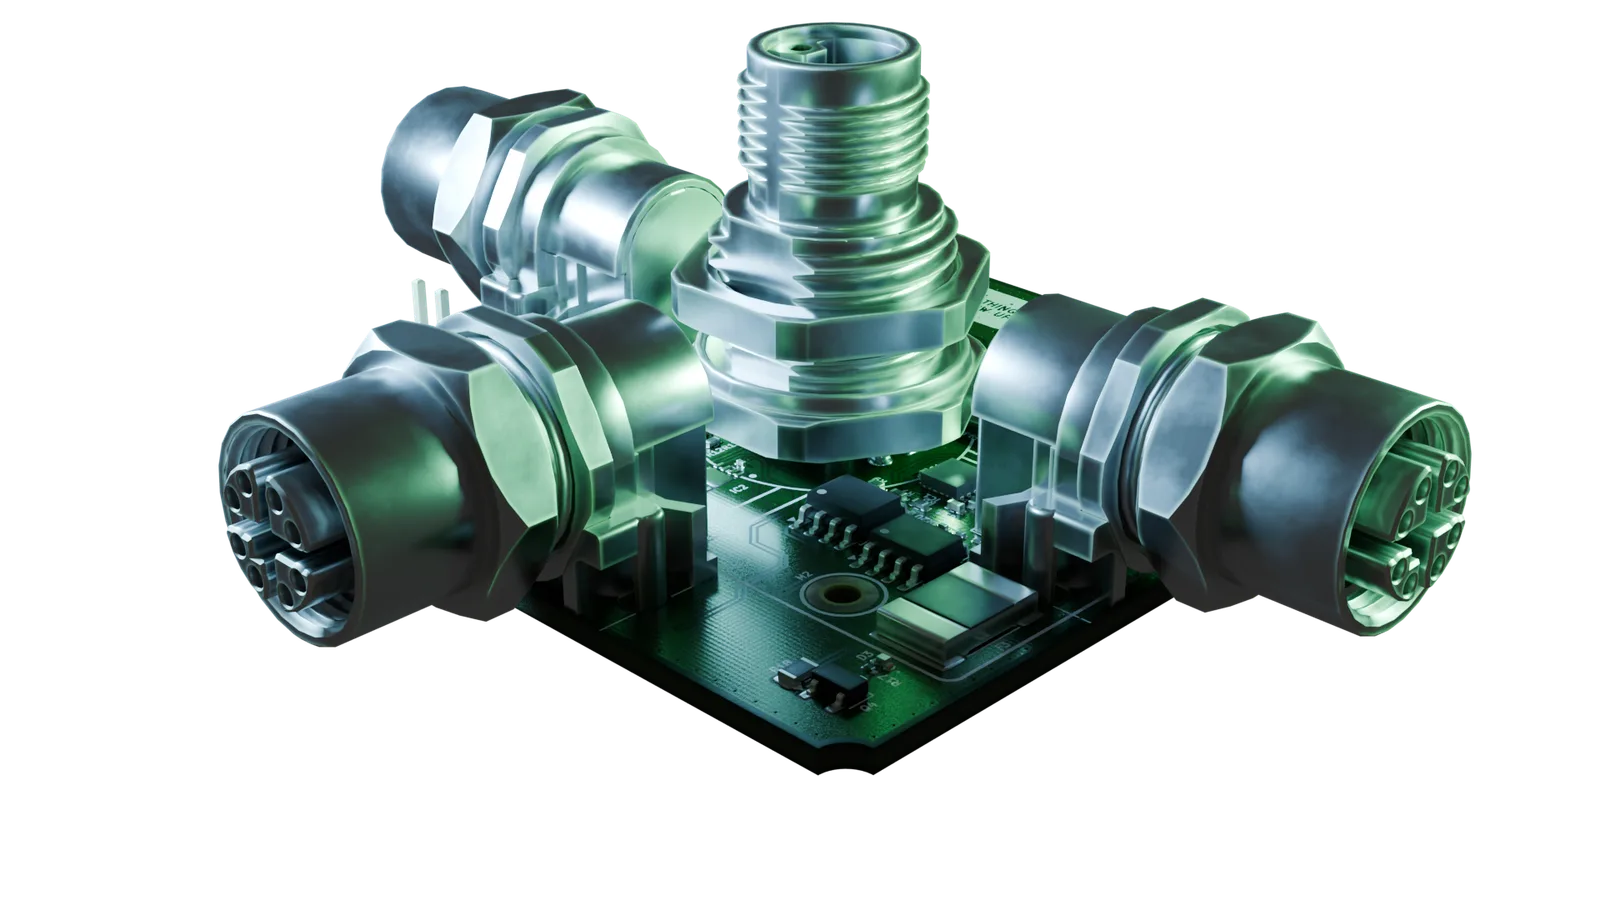
Hub board Node board Probe board

Probe. Node. Hub.

Three devices, one system. You're about to see inside each one.

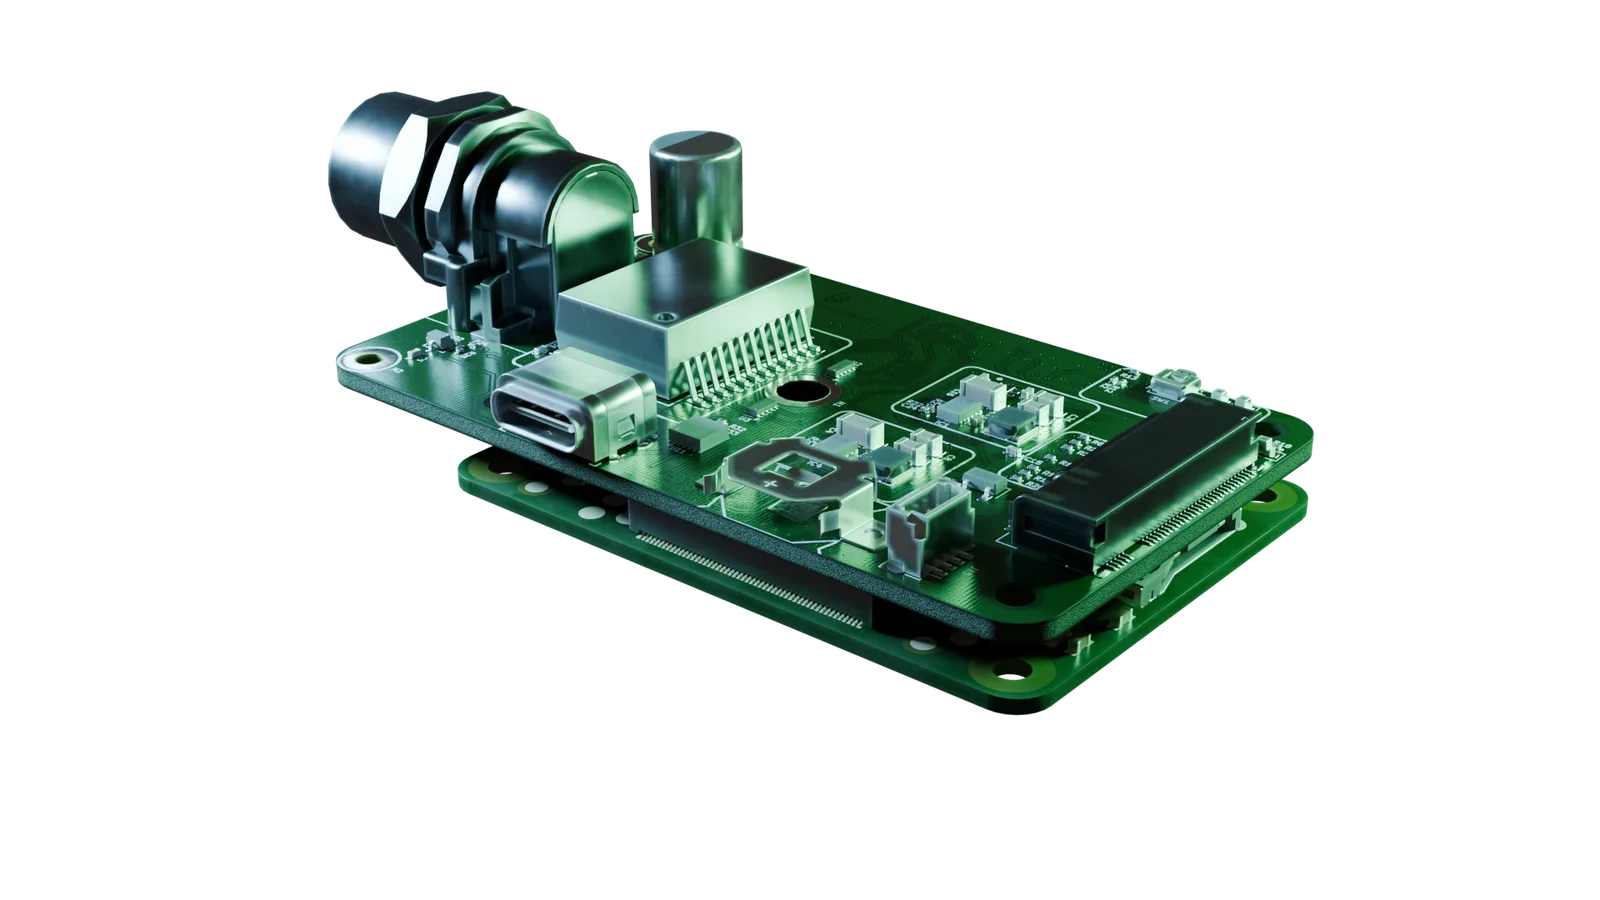
The Probe · At the machine

Measures where it happens.

At the bearing, the spindle, the drive: the Probe sits right at the machine and reads the sensors.

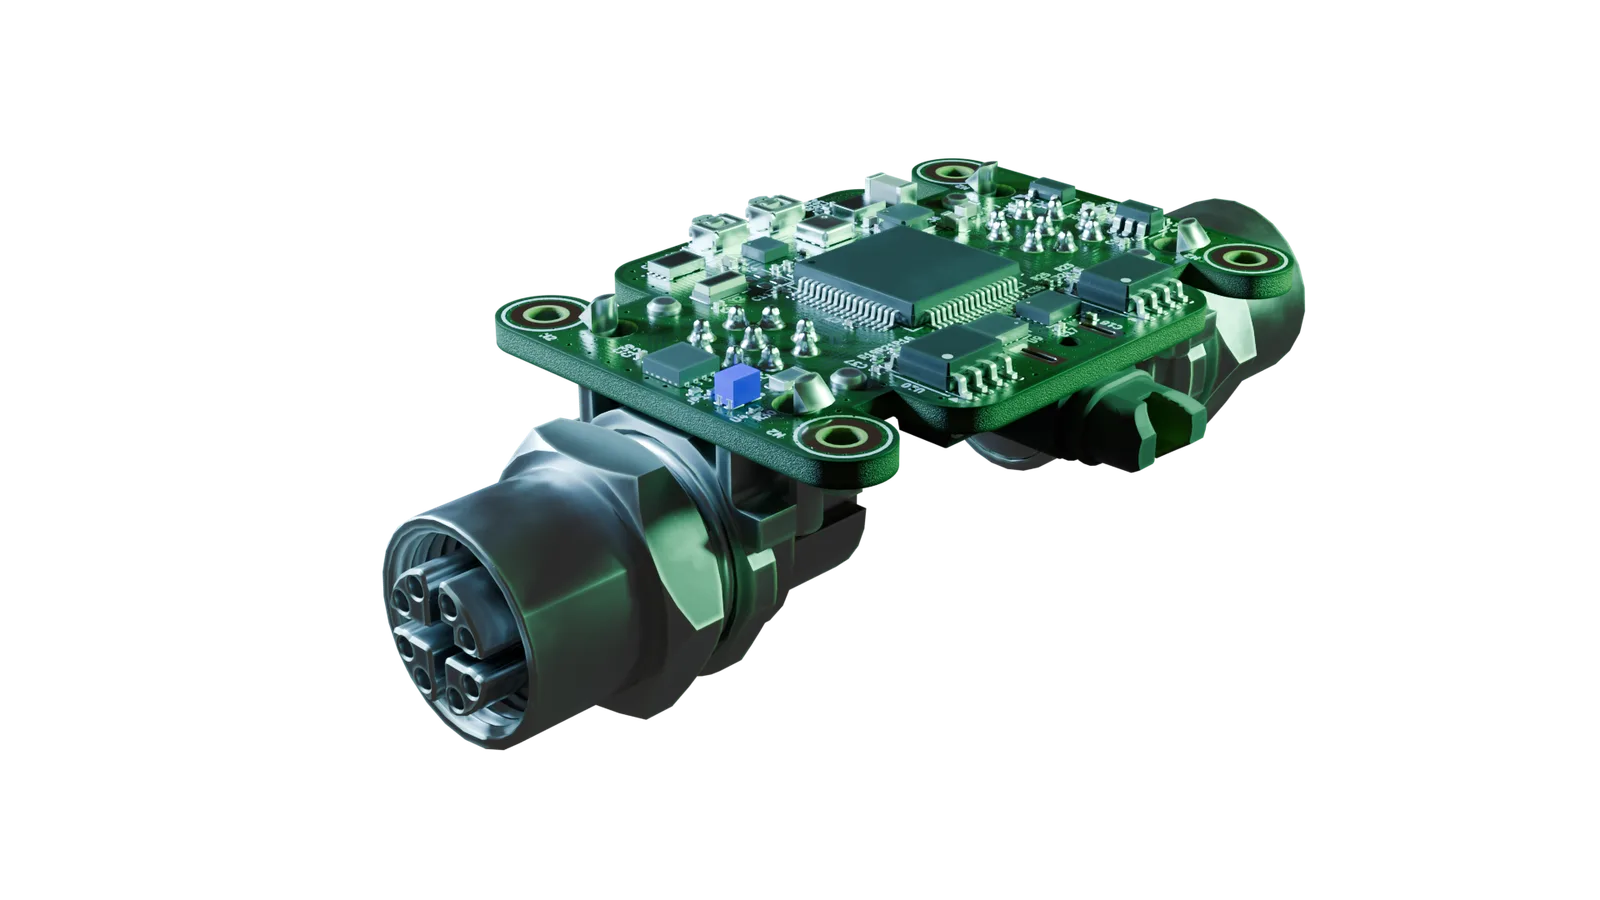
Exploded view of the Probe board: the case opens, the board with its STM32H5 and the two M12 connectors floats free

To move the measuring point closer to the bearing, undo the M12 and plug it back in. The chain grows with you. Plug a third Probe for the new spindle into the chain and it's detected automatically. No project freeze, no rebuild.

The Node · Near the machine

Computes where it's measured.

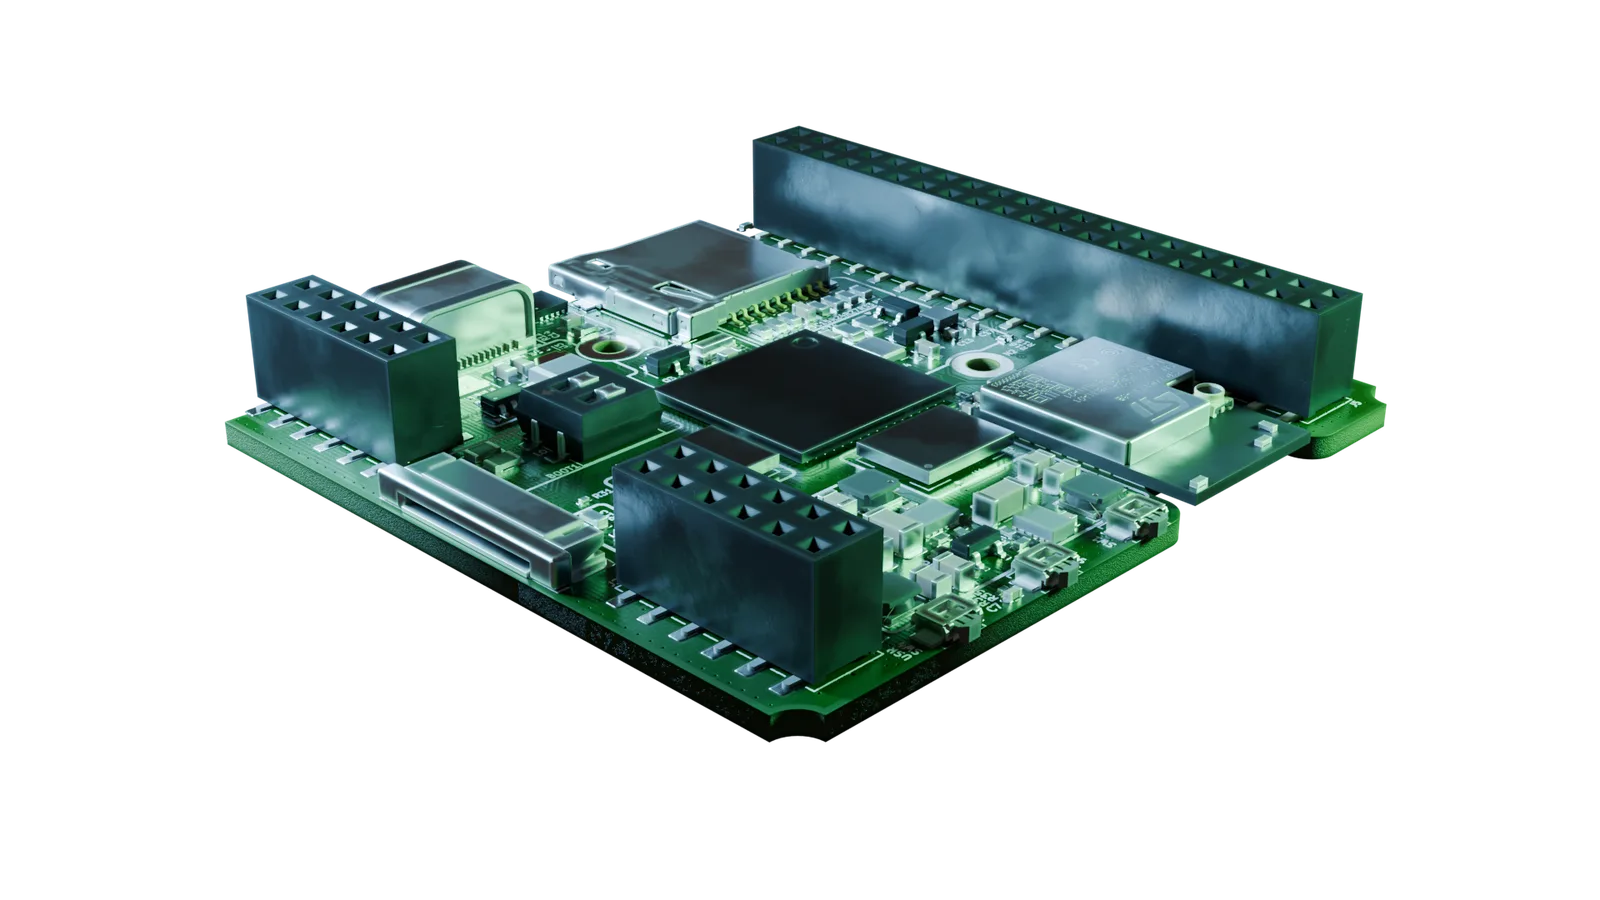
The Node bundles its Probe chain, processes the values locally, and sends the results to the Hub wirelessly.

Exploded view of the Node board: six layers fan out – lid, connector board with M12 connectors for power and CAN bus, frame, shielding, board with STM32N6, base

For a new machine, put a Node next to it and plug in the Probes. No cable back to a central point, no new switch port. And the AI runs right on the board.

The Hub · On-premise in the plant

Orchestrates the whole plant.

The Hub collects the results from all Nodes and runs the large AI models. This is where the measurement meets the knowledge in your documents, on-premise, inside the plant.

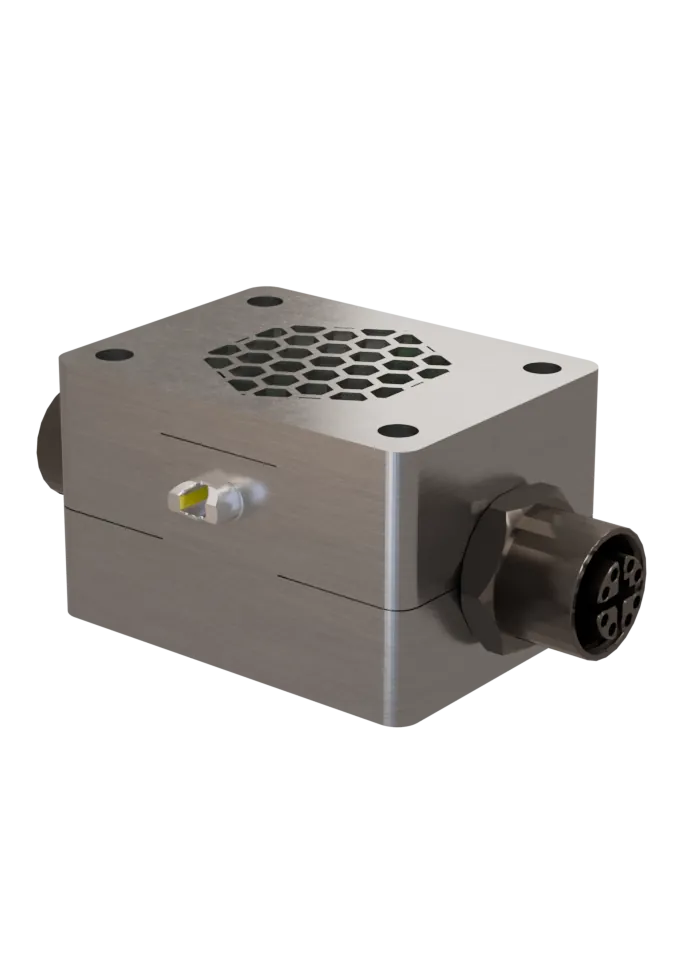
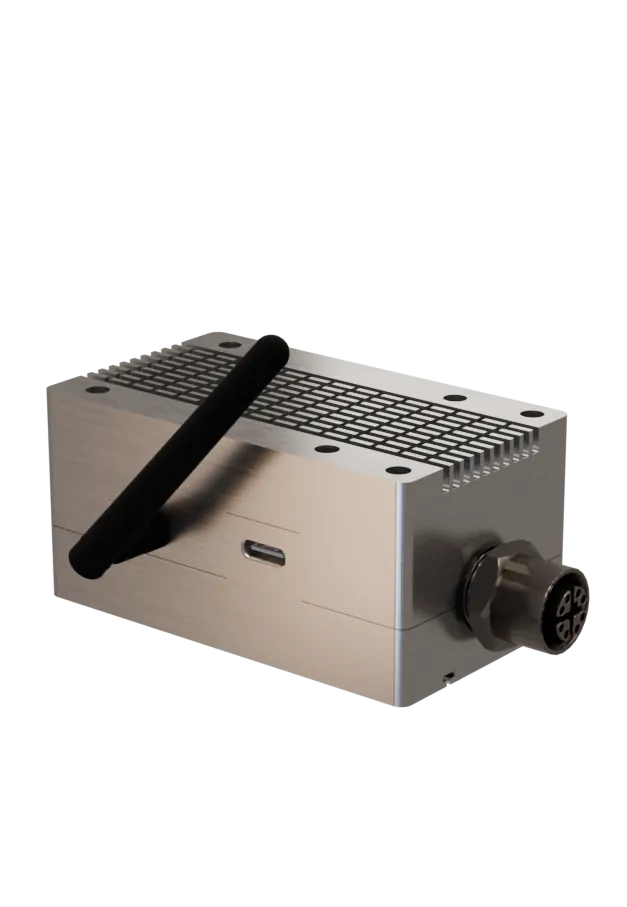
Exploded view of the Hub board: the finned lid with its WiFi antenna lifts off, revealing the compute module on its carrier board with USB-C and M12

Today a Raspberry CM5 does the computing, or a Jetson Orin Nano when your models need more. And the Hub talks to LOKI: ask your production in plain sentences.

Topology & scale

Hierarchical. Scalable. Robust.

One Hub orchestrates any number of Nodes, each Node any number of Probes. Probes chain together freely, and the Nodes reach the Hub wirelessly.

HUB one orchestrator

Scales to the whole plant. New Nodes are detected automatically.

NODE one per machine

Every machine gets its own Node. That's all it takes.

PROBE several per Node

The chain gets longer, not the project. Plug in, keep measuring.

Example: 1 Hub · 3 Nodes · 9 Probes

The lineup

Six boards. One kit.

Compute, interface, sensing. Every board an in-house design, all freely combinable.

Compute Processing
Node board
Node board TinyML on-device.
Hub board
Hub board The AI orchestrator.
Interface Connectivity
IO-Link module
IO-Link module IO-Link, now on the CAN bus.
SPAM module
SPAM module Sensor & peripheral mesh.
Sensor Measurement
Probe board
Probe board Vibration, temperature, magnetics.
Energy board
Energy board Current, voltage, power. In real time. KEY ASSET FOR CSRD REPORTING
No lock-in

Your system. Your data. Your pace.

Your MES wants the data?

It gets them via API, MQTT, or straight from the database. No third-party cloud, no paywall: you connect your systems, not the other way around.

IO-Link sensors already in the machine?

They stay. The IO-Link module brings them onto the CAN bus and into the chain.

A sensor no longer fits?

Probe off, new one on, detected automatically. The measuring point grows with you.

Models outgrowing the Hub?

Upgrade the Hub board to a Jetson Orin Nano. Everything else stays as it is.

Integrating for clients?

Plug in a new interface module and the Node detects it automatically. Open standards: CAN bus, IO-Link, WiFi. Not a black box.

No internet on the shop floor?

MINERVA runs fully offline behind the plant firewall. No cloud dependency, no data leakage.

Effortless

Plug-and-play, even for non-specialists.

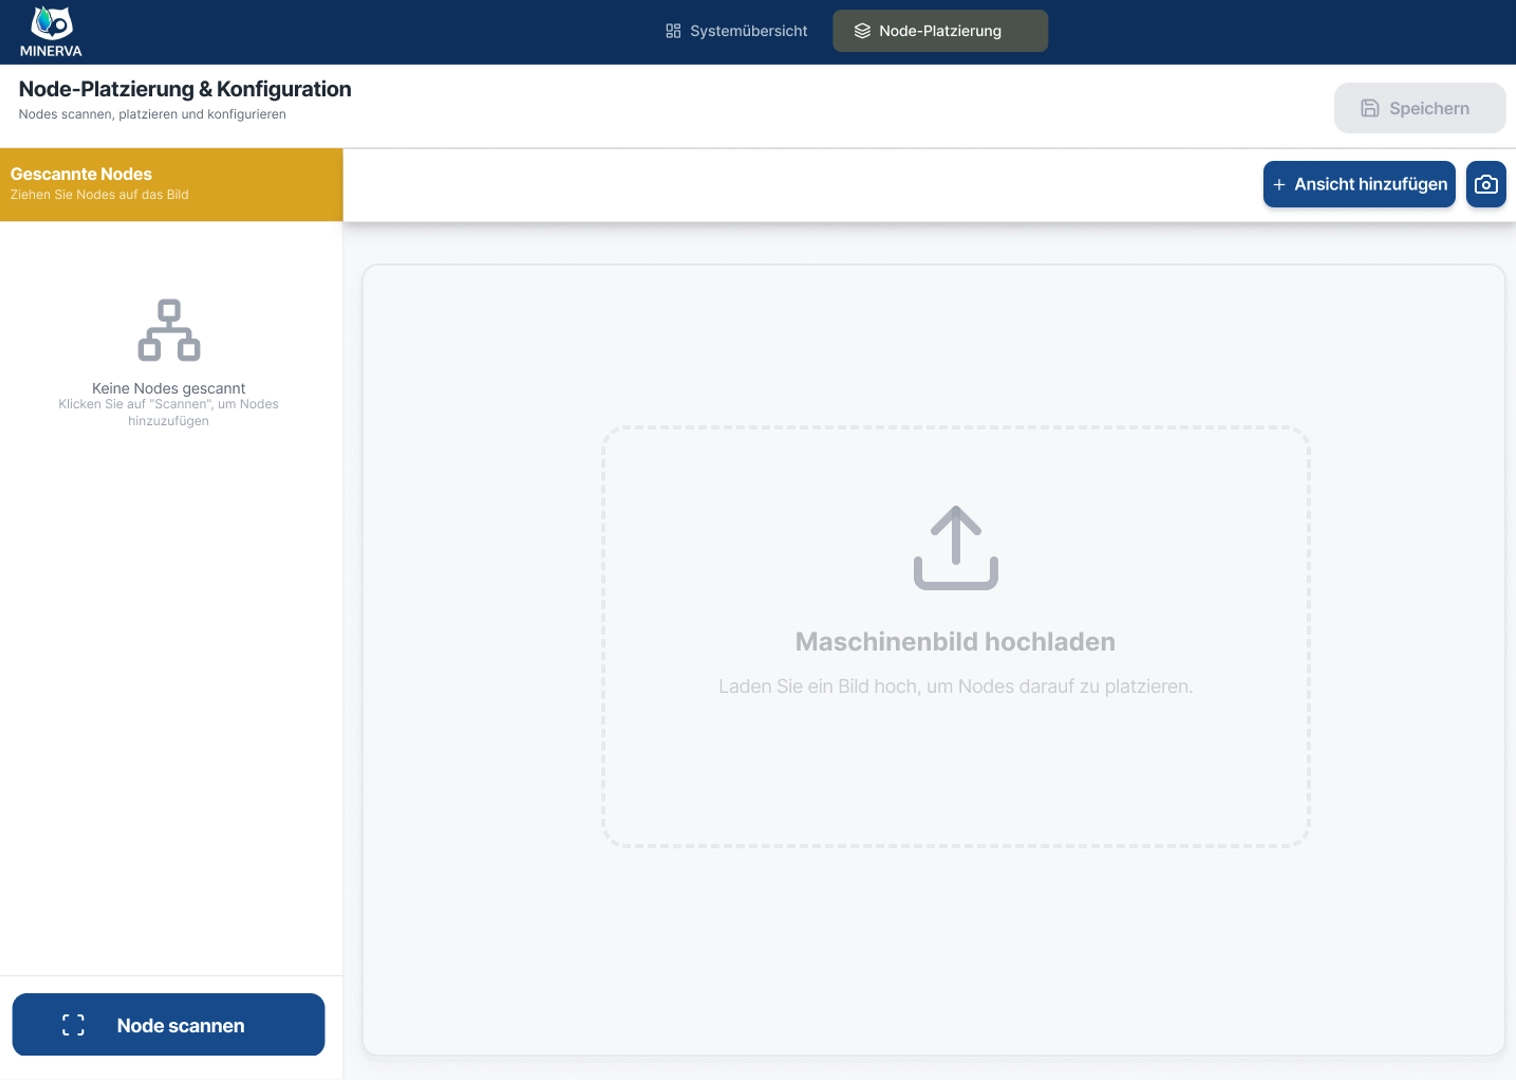
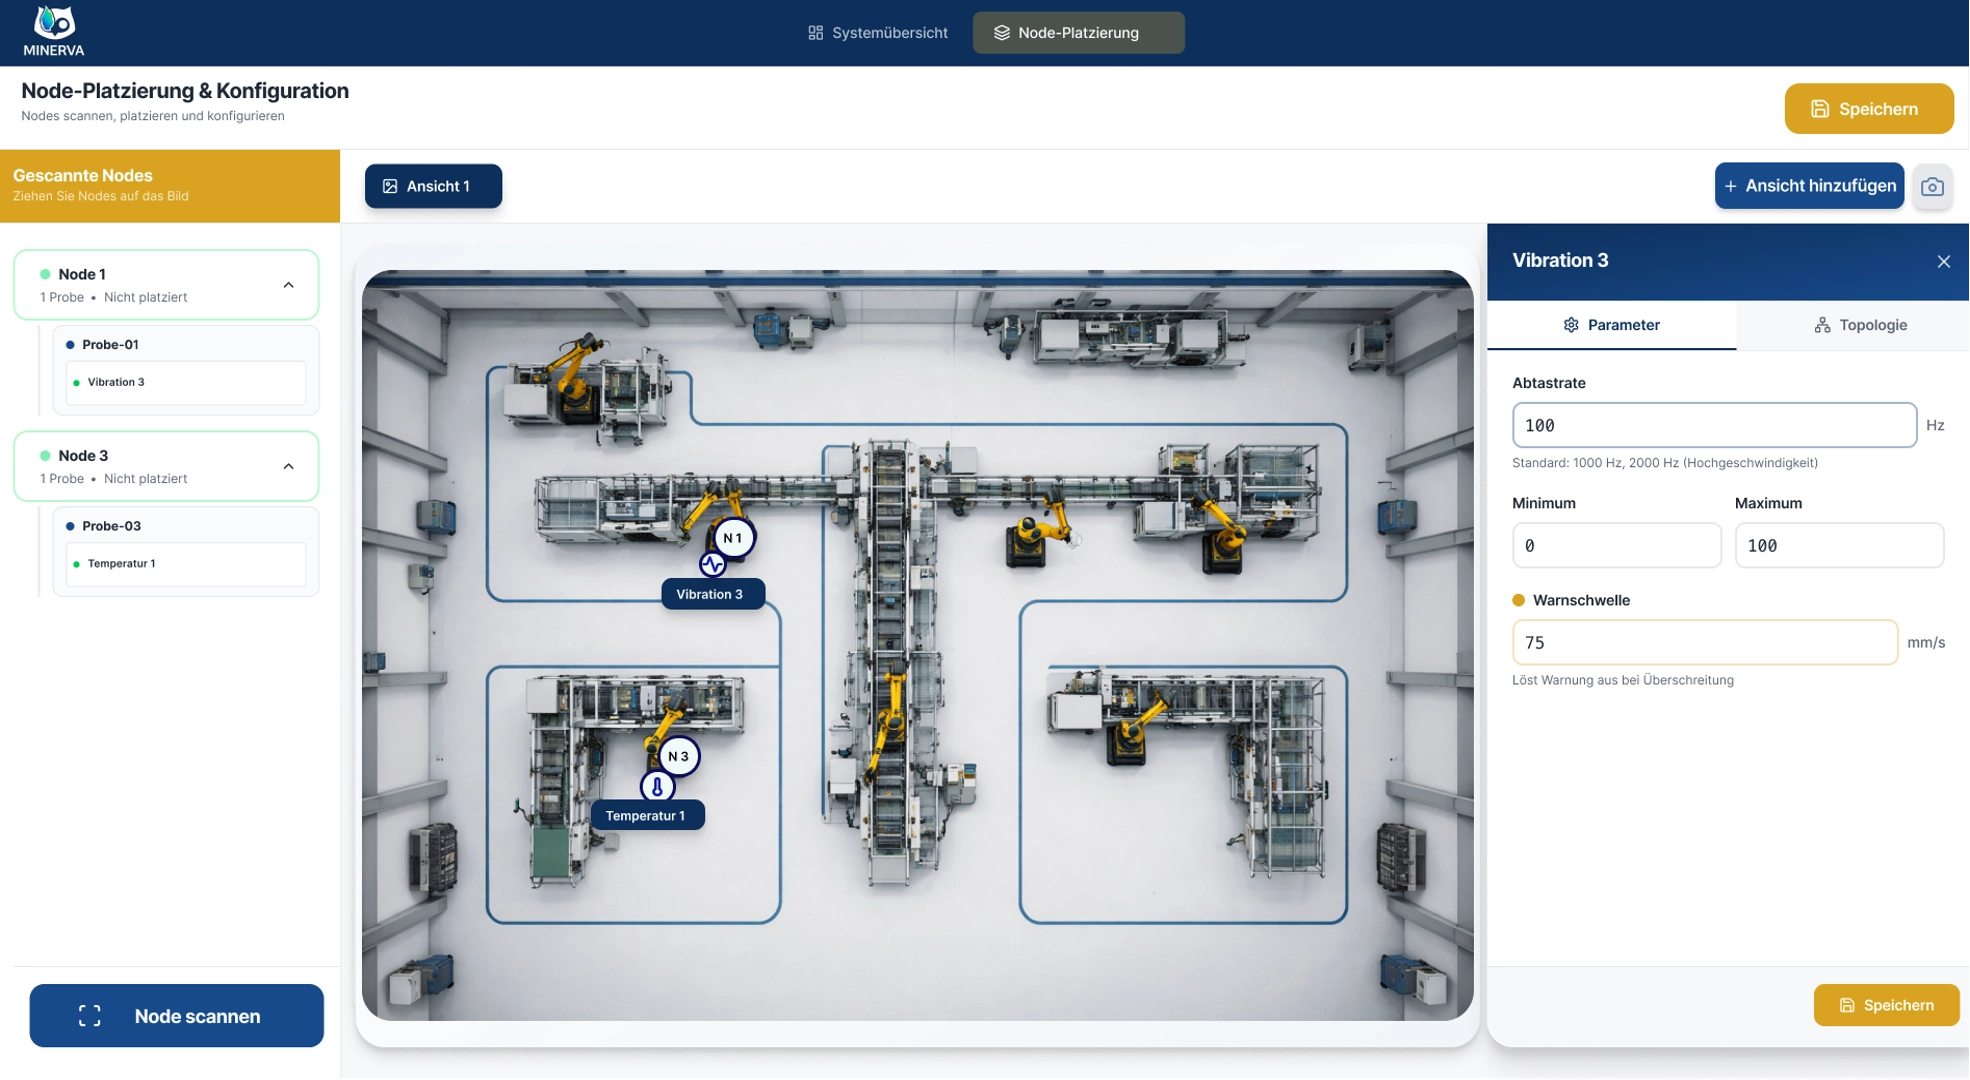
Scan sensors, drag onto the plant photo, done. The plant crew makes changes themselves. No IT project.

01

Scan the Node

New hardware is detected automatically. No manual IP configuration.

Empty plant area, ready for the floor-plan upload
02

Place the Node

Drag-and-drop onto a photo of the plant. Visual mapping without CAD.

Top-down view of the production floor with placed Node markers
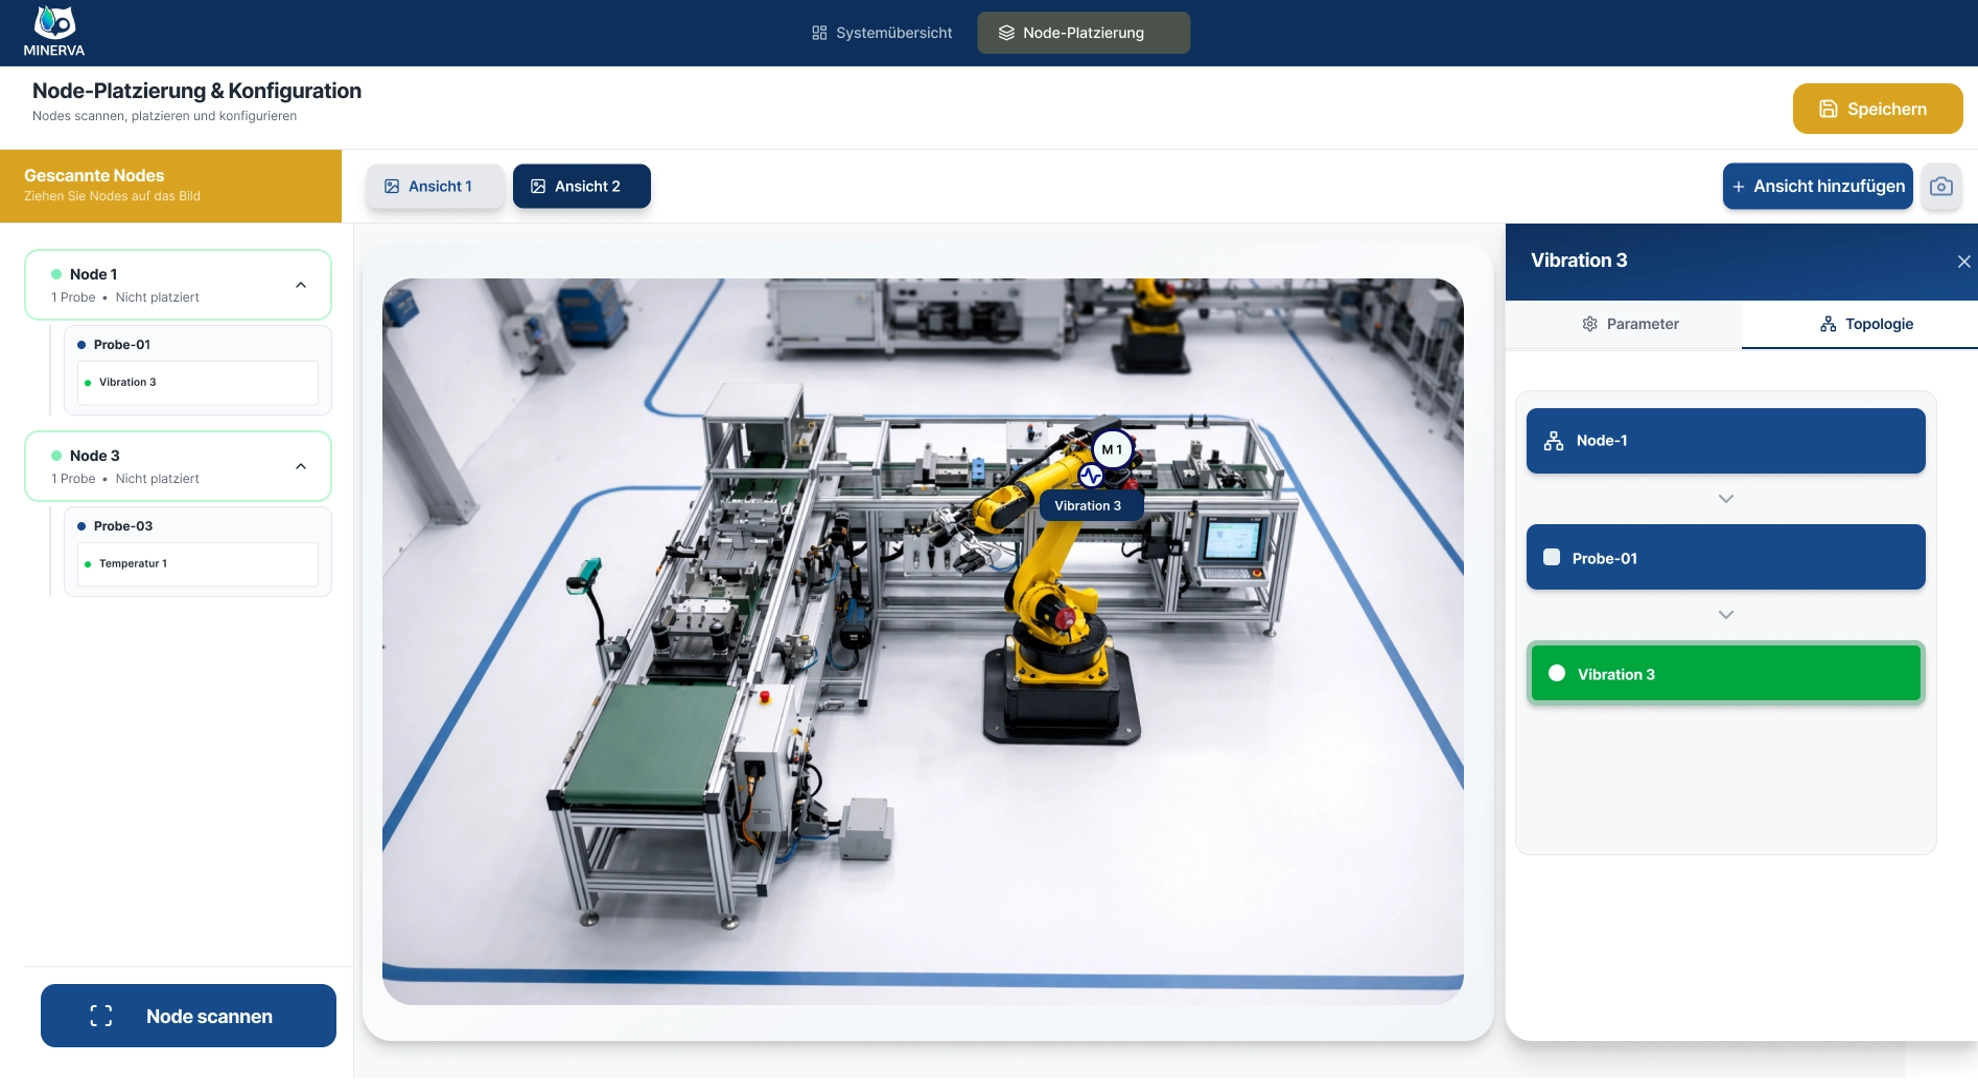
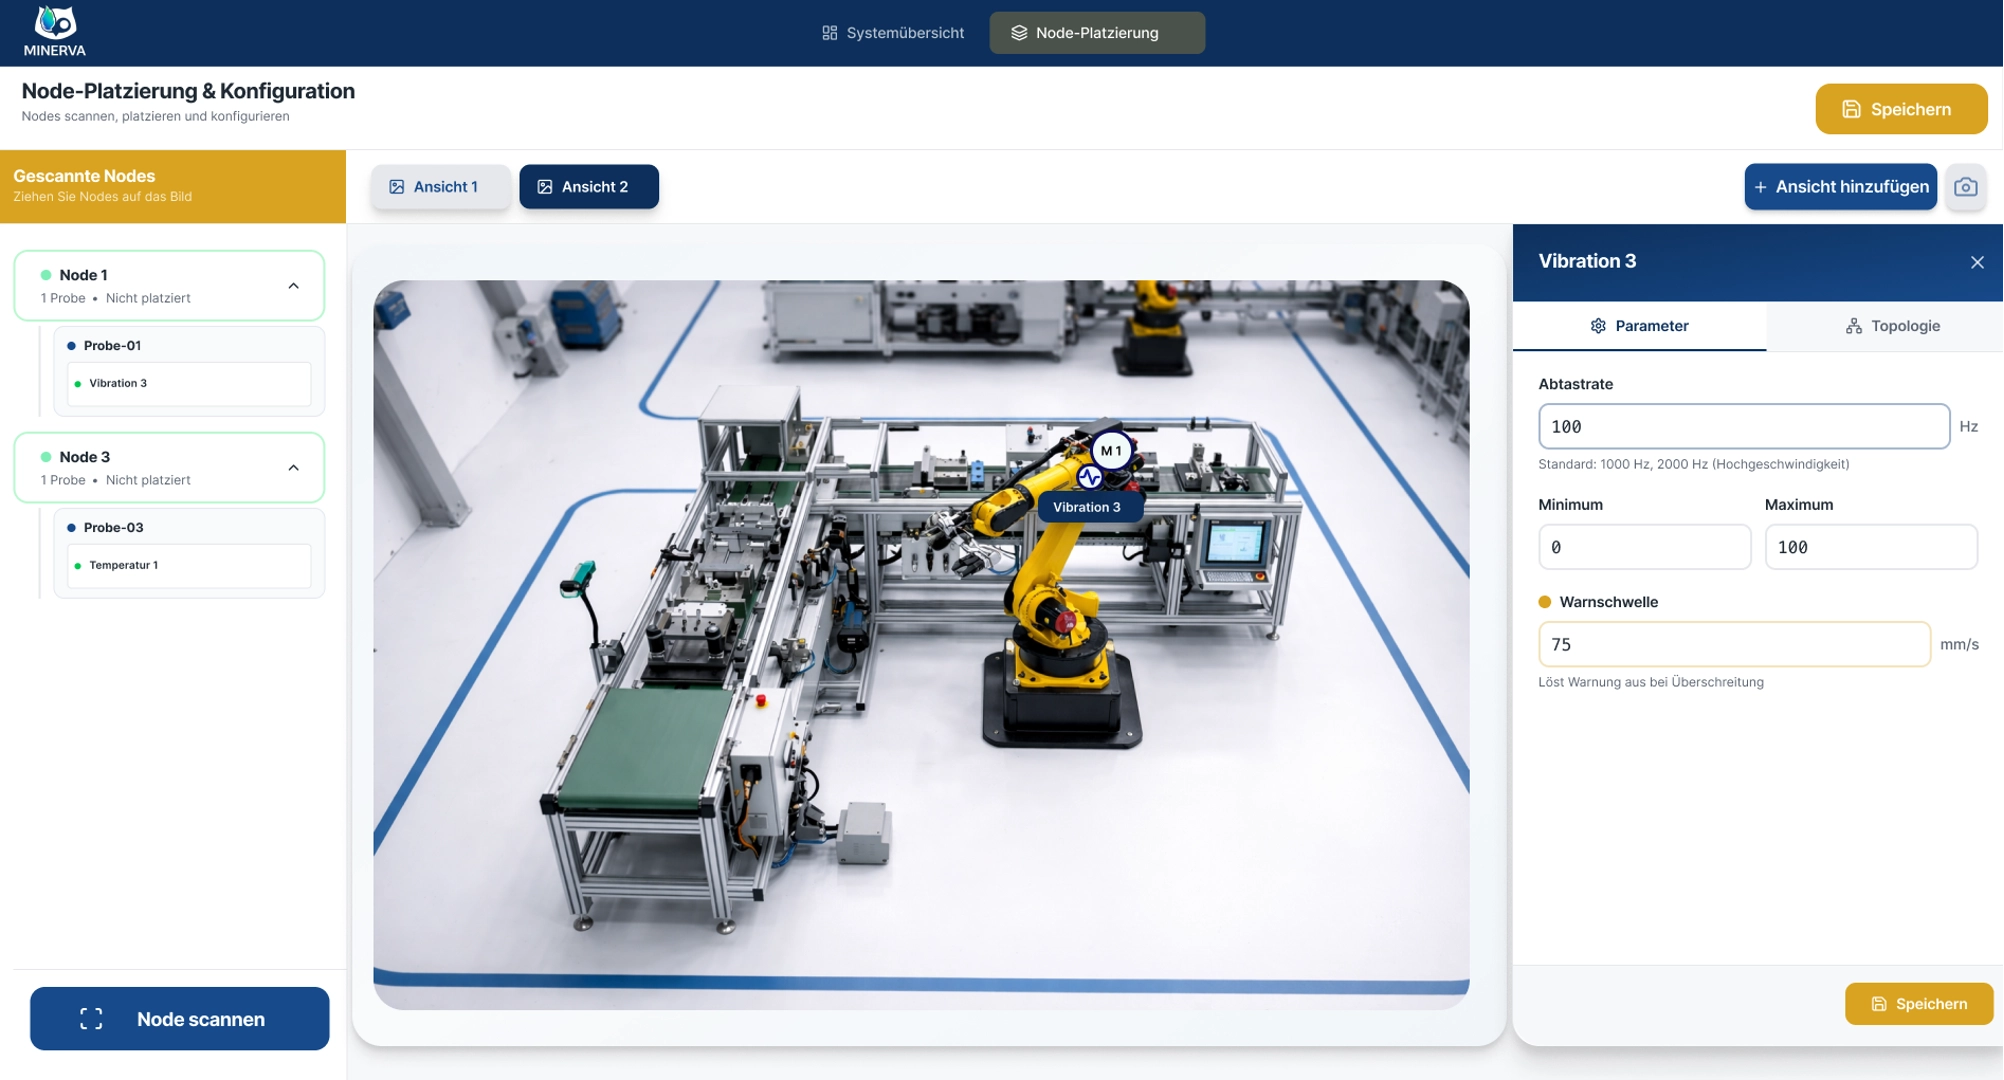
03

Configure

Thresholds, sample rates, alarms. All directly in the web UI.

Topology view: Node-Probe hierarchy next to the placed sensor
Parameter settings with a vibration threshold for a sensor

A modern front-end for the plant crew. Not an engineering tool.

Energy & CSRD

MINERVA turns energy data into leverage.

What cloud solutions cannot do. And why it matters for CSRD reporting.

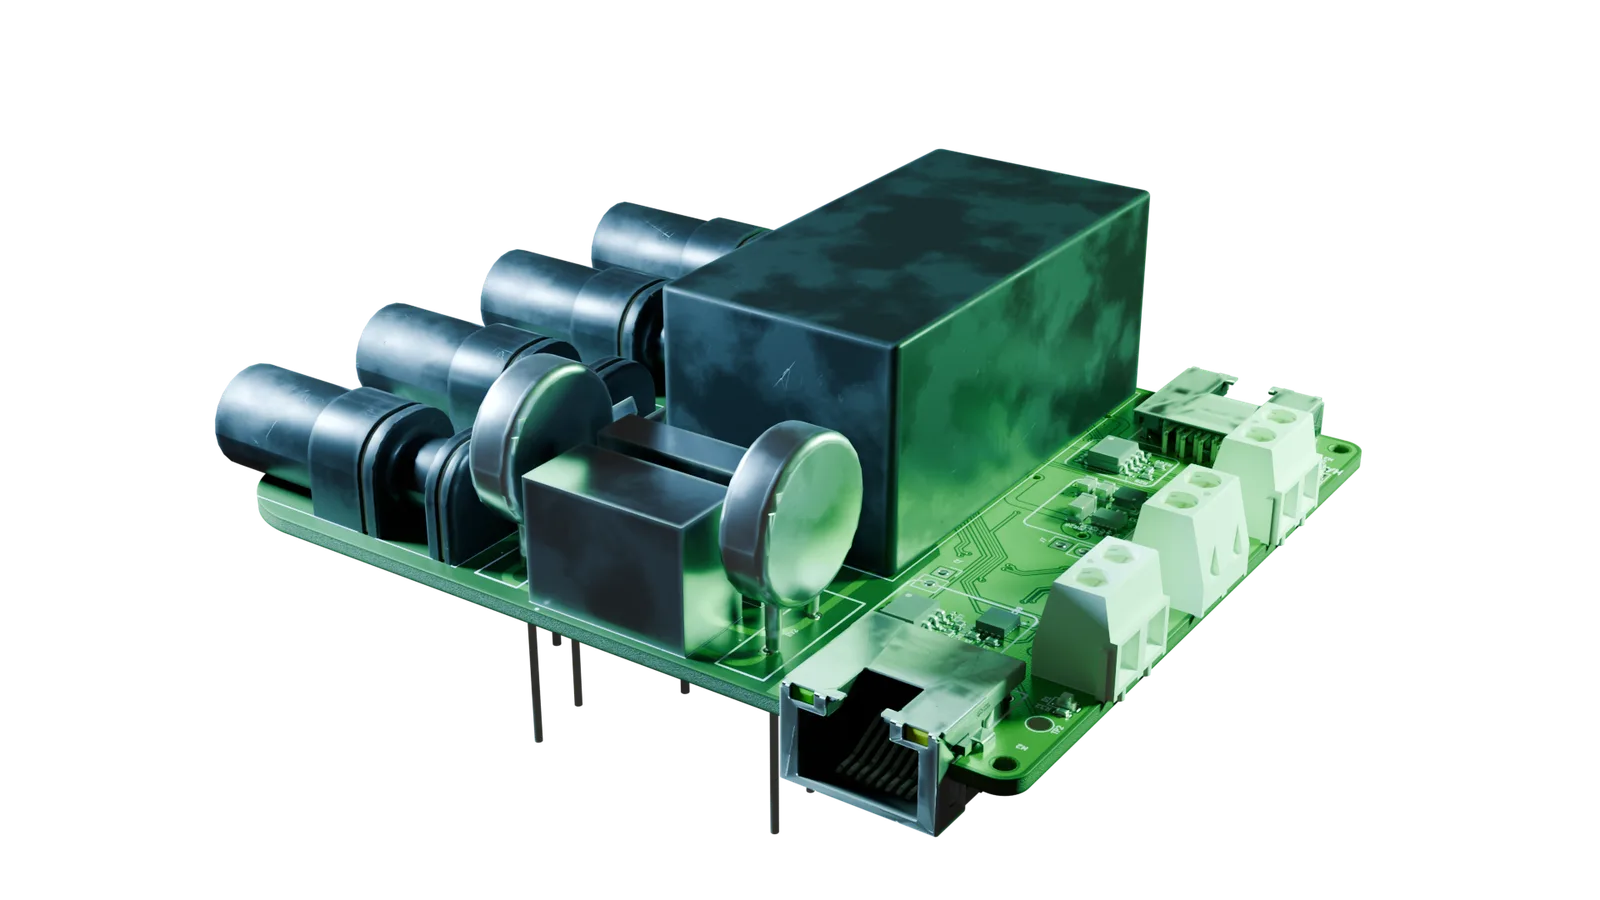
The MINERVA energy board on a clear background: a circuit board with current and voltage measurement channels, terminal blocks and a microcontroller.

Energy board

Current, voltage and power measurement at the machine level, deployed as a Probe board directly at the consumer.

CSRD compliance without estimates

Direct measurement instead of guesses. Machine-level energy data as evidence in sustainability reporting.

Detect & smooth peak loads

Live load profiles per machine identify consumption peaks. Cuts grid fees and reduces energy costs.

Predictive maintenance + energy

Rising consumption is often the first sign of mechanical wear. One sensor stack, two use cases.

Industrial AI as a lever for impact. Not as another energy hog. You query the load profiles in plain sentences.

ONE MEMORY

MINERVA listens. And LOKI answers.

On the shop floor

What needs doing on line 3?

MINERVA

The drive shut off at 14:20 because of bearing 2 – vibration had been climbing since this morning, the same pattern as six weeks ago. Inspection step in manual 4.3, and the spare bearing is on the shelf.

3 sources used ▾
In the office

How is production running right now?

LOKI

Three of four lines are running; line 3 has been down since 14:20. Utilization today is 82 %, with two unplanned stops – both on line 3. The weekly trend stays steady.

2 sources used ▾
MINERVA dashboard with sensor values, trends, and a threshold alert

Machine data and company knowledge share one memory. A question from either side reaches all of it. Each also works on its own.

LOKI live More about LOKI
Compliance

What data protection and audit will ask.

GDPR without a processing agreement, ISO 27001 as a declared goal, the EU AI Act built into the product, access rights that reach down into the vector index. We have written down how that comes about technically.

Go to the compliance page
DESIGN PARTNER PROGRAM

The design partner program is running.
Limited places for 2026.

If you run production lines and want to understand machine data in real time, without handing it to the cloud, come in as a design partner. You get MINERVA on the shop floor early. Your requirements go straight into development. And you lock in first-series terms.

For manufacturers, automation specialists, integrators, and system houses.

Technical details Boards, interfaces & specs
Node board (compute) STM32N6 – TinyML on the board itself, low power
Hub board (compute) Raspberry CM5 or Jetson Orin Nano – for larger AI models, passively cooled
Probe board (sensor) STM32H5 – accelerometer, magnetometer, temperature
Energy board Current, voltage and power metering in real time, as evidence for CSRD
IO-Link module Connects IO-Link sensors to the node via the CAN bus
SPAM module Sensor & Peripheral Access Mesh – multi-probe bus
Networking CAN bus between probe and node, WiFi between node and hub; hub uplink: Gigabit Ethernet over M12 with PoE (802.3bt)
Data access Raw data via API, MQTT, or database – your choice
Enclosure & service Bolted aluminum enclosures; USB-C for service and power delivery
Scaling 1 hub, any number of nodes, multiple probes per node
Manufacturing All boards developed in-house – no white-label, no reseller

Still have questions?

Read the FAQ